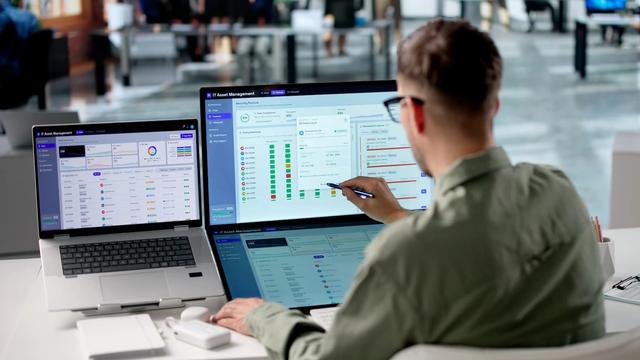
The reports every operations owner should have
You don't need forty dashboards — you need a few reports that actually run your business. Here are the ones every operations owner should have at their fingertips.


The short answer: an operations owner needs a small set of reports that answer the questions that actually run the business — where the money and time go, what's slipping, what's working, and what's coming. Not a wall of dashboards; a handful of trustworthy views you can check quickly and act on.
The short version
- You need a few decision-driving reports, not dozens of charts.
- The essentials cover cost, slippage, performance and the forward view.
- Each should be current, trustworthy and quick to read.
- If a report doesn't change a decision, it's not essential.
The essential few
Almost every operation, whatever the industry, runs better with these four in reach:
- Where the money and time go — which parts of the operation cost the most, so you know where efficiency pays off. This is the report that tells you whether a service line is actually profitable once you count the hours behind it.
- What's slipping — customers, jobs, orders or payments quietly falling through, so you catch them before they cost you. Ageing invoices, jobs past their timeline, customers whose activity has dropped.
- What's working — your best channels, services or customers, so you do more of what wins. The 20 per cent of your work that drives most of the return.
- The forward view — enough of a look ahead (pipeline, bookings, capacity) to plan staff and cash before you're caught out.
Why these four
Between them, these answer the questions an owner actually acts on: where to cut waste, what to rescue, what to double down on, and what to prepare for. Everything else is either a detail that belongs in a specific team's view, or a vanity metric that doesn't change a decision.
You can see how they map to real weekly choices. The cost report tells you where to focus. The slippage report tells you what to chase this week. The performance report tells you where to spend your marketing and effort. The forward view tells you whether to hire, and when. That's most of running a business, on four reports.
What these look like for a real business
Take a small electrical contracting business. The four reports aren't abstract — they're concrete cuts of the work.
- Where the money and time go: job profitability by type — new builds versus maintenance versus emergency callouts — with labour hours costed in, not just materials. This is the one that quietly tells you which work to chase and which to price up or walk away from.
- What's slipping: a list of invoices past 30 days, jobs open longer than their estimated duration, and quotes sent but not followed up. One screen, checked every Monday.
- What's working: which lead sources actually convert to paid work, so the marketing spend goes where the paying jobs come from rather than where the enquiries feel busiest.
- The forward view: confirmed jobs for the next six weeks against the crew's available hours, so the owner knows whether to put on another apprentice or turn work away before committing either way.
None of these needs new data. They're all cuts of the quotes, timesheets, jobs and invoices the business already records. What's missing today is that the data lives in four tools, so nobody builds the reports. Join it up and they're just there.
Keep them current and simple
A report you check weekly and trust beats a real-time dashboard you don't believe. Aim for clear, current and simple — the number, the trend, and just enough context to act. Resist the urge to add "just one more chart." The value is in focus. Every extra number you add dilutes the attention on the ones that matter.
Where do industry-specific reports fit?
The four themes are universal, but the cuts underneath them are not. A clinic watches practitioner utilisation and no-show rates. A retailer watches stock turn and shrinkage. A trades business watches job margin and crew capacity. Same four questions — where money goes, what's slipping, what's working, what's coming — answered with the numbers that actually move your particular business.
That's why there's no off-the-shelf "operations dashboard" that fits everyone. The themes are shared; the specifics come from how you work. Getting those specifics right is exactly the diagnosis work worth doing before anything gets built — because a report cut to the wrong measure is just a firehose with your logo on it.
The role of one connected system
These reports are only easy when the data behind them is together and accurate. On scattered tools, each report is a manual assembly job — export, reconcile, hope the numbers agree — so they don't get produced, or they get produced late and half-trusted. On one connected system, they largely produce themselves, because the data is already in one place and current. That's the difference between a report you build once a quarter with dread and one that's just there when you need it.
Related reading
- What business reporting should actually tell you
- Retention and repeat business: the metrics hiding in your data
- From data to decisions: the complete guide
The honest first step
The right reports for your business depend on the decisions you actually make. A trades business, a clinic and a retailer share the same four themes but need different cuts underneath them. Understanding how your operation runs reveals which decisions matter — and the few reports worth building around them.
Tell us what you run, and we'll show you what's possible.